N3KL Propagation Indicators
Last Solar Month's Solar-Terrestrial Data, N0NBH: UV and X-ray |
- 304A: Ultraviolet radiation at 304 Ångström due to ionized helium in the sun's photosphere. One value measured by the Solar Dynamics Observatory's EVE instrument, and the other by the SOHO satellite's SEM instrument. Responsible for about half of the F layer ionization.
- X-Ray: Intensity of hard X-rays hitting the earth’s ionosphere. Impacts primarily the D-layer (HF absorption). Value from A0.0 to X9.9. The letter indicates the order of magnitude (A, B, C, M and X), where A is the lowest. The number further defines the level of radiation.
Mg II doublet (280 nm = 2800 Å)

K index from Dombås, Norway (geomagnetic activity):

Source: University of Tromsø. Dombås is 62 deg N and 9 deg E. K > 5 => Northern Lights as far south as in Oslo (55 deg geomagnetic latitude, 60 deg geographic). A map with levels typical for viewing Northern Lights according to location in Europe is here Aurora Service Europe
One Year Solar-Terrestrial Activity Report

Credit: Jan Alvestad
Last two solar cycles

Credit: Jan Alvestad
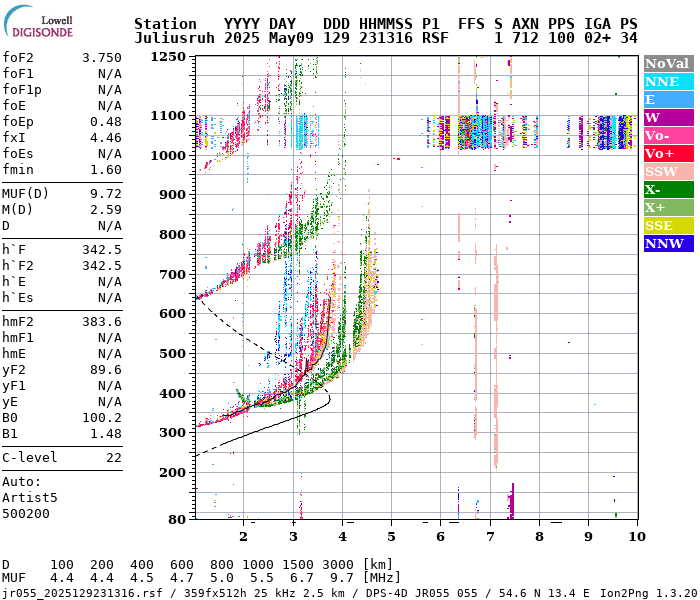
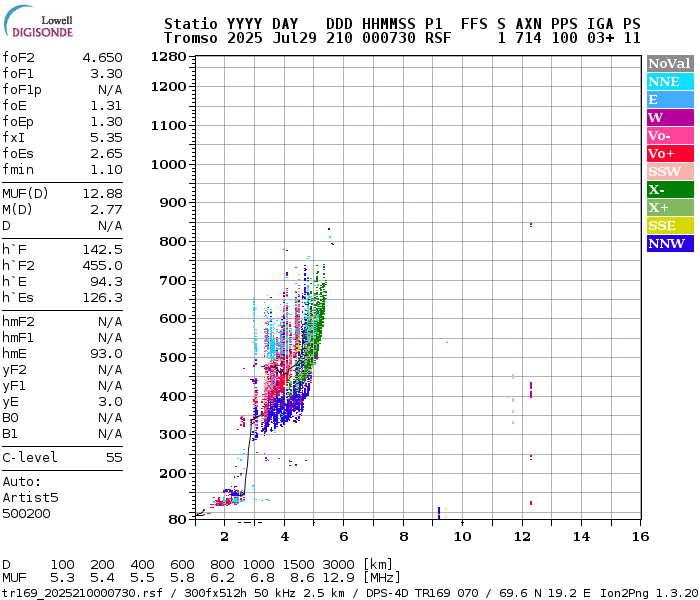
Examples of interpreted ionograms (WA5YIX)Ionosondes
Juliansruh (Northern Germany):
Tromsø (Northern Norway):
NCDXF/IARU International Beacon Project

- Live "on air" beacon page, IZ0IEN
- Monitoring stations all over the world
RF Seismograph
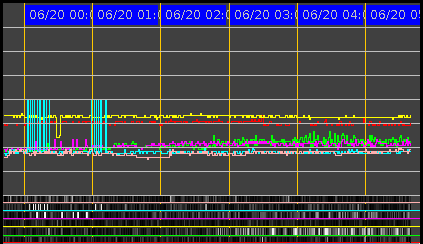
- Local RF-Propagation at the MDSR Test Site in Vancouver, BC
- ARRL: VE7DXW’s “RF Seismograph” May Be Real Seismograph
The Cormac Propadex - Current Ionospheric Conditions Propadex is updated four times per hour and eight hours of history is shown on the graph. For example, if the Propadex shows +110, it means that the maximum usable frequency is 1.10 MHz higher than the 60 day average for this exact same time of day. | Statistics based on the 250 lasts spots from the OH2AQ web cluster |
Other resources
- VOACAP DX Charts
- European sporadic E (G7IZU)
- VHF propagation map based on APRS
- Hepburn's tropospheric ducting forecast: Northwestern Europe, Europe
- WM7D's Solar Resource Page
- The 9 MHz rule for selection of HF band: search above 9 MHz in the morning and early daytime hours, and search below 9 MHz in the late afternoon and evening hours.
- The HandyMan's Guide to Solar/Geomagnetic Conditions, Paul Harden, NA5N
- K9LA’s Amateur Radio Propagation Web Site (Carl Luetzelschwab)
- RSGB Propagation Studies Committee pages
- Space weather live
- What's My Geomagnetic Latitude?
- Real-time lightning detection and localization network
- Effective sunspot number, SSNe
- Northern lights forecast, Northern Lights
- Rate of TEC (Total Electron Content) Index (ROTI)
- The wanted - alive, by Jukka OH2BUA
Just found this site, good stuff, thank you so much
ReplyDelete